When the winner of the game cannot be decided after the 90 minutes of play, the game goes into extra time of 30 minutes. There are 29 games which went into extra time. In this extra time total 54 goals were scored.
Let's add this games into our analysis.
This plot shows Number of goals scored at each minute of playtime, this time extra time is included
GOAL DISTRIBUTION
Extra Time
Performance of USA in FIFA Worldcups

Performance comparison between USA and World cup winners and runners up shows a clear separation between USA and them. The USA participated in 10 of world cup and 70%of the games in last two decades. In order to improve chances of qualifying for QF, SF, or even Final, the focus should be on scoring more goals against weaker teams.

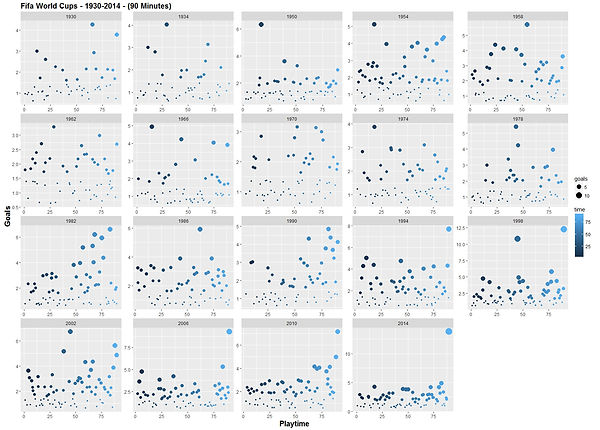
When we divide 90 minutes of game into two halves, we observe that second half is more interesting. More goals have scored in second half.
If we further divide the game duration into 6 time intervals (15 minutes each), we see that the game starts slow, picks up the pace during next 15 minutes and then again goes into lull of 15 minutes. In second half, things get interesting as time goes.
Looking at time interval of 3 minutes, we notice that first 3 minutes in both the halves are slow.
Finally when we examine each minute of the game, it is clear that last minute of each half is pack of action. 90th minute is a shooting star. 31 countries scored a 90th-minute goal, 14 of them ended in a draw, and 20 of them ended in a result. The USA benefitted 4 out of6 games by scoring in 90th Minutes.
If you have only one minute to watch soccer game, we suggest shoot for 90th minute.
A total of 83 Countries participated in Fifa World Cup (1930-2014) but world Cup winner is always from top 10 countries.Brazil has played highest number of games, 89 in 20 WorldCup Tournaments. Brazil has scored more goals in second half than in first half. The same is true for USA, Spain and Germany. England, Italy, Uruguay and Argentina do not show significant pattern in goal distribution. For France, 90th minute is shooting star.


If we zoom in the extra time, we can examin for the goal distribution trends more closely.
Looking at the this plot, we see that 3rd minute of extra time (or 93rd minute of the game) gets interesting. But, in general we don't see any apparent pattern forming.
We may say that there is no particular trend for goal distribution across extra time.
We need to keep in mind that we have only 29 data-points which are less. This might be the reason we don't see any pattern forming.

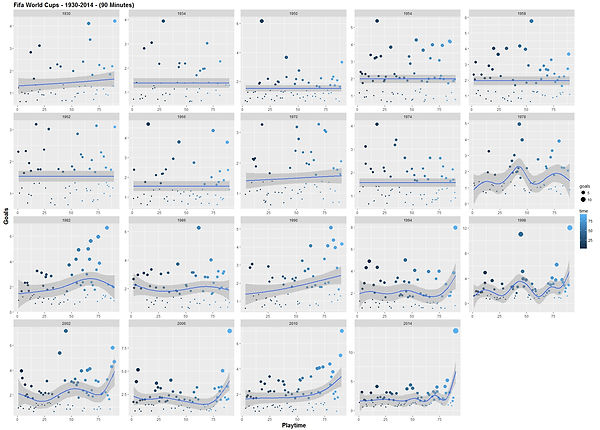
Visualizing data by World Cup, once again it reveals 90th-minute goal is increasing in last two decades.
In last two decades, the 90th minute has become very significant, a deciding factor. A whopping 83% goals were scored in the 90th-minute.
If not already, we believe teams should develop a strategy for last 5 minutes by calling in substitutes with more aggressive players. Let's investigate players.
We had data of 820 games played in FIFA WorldCups, in which 2,327 goals were scored. We investigated how these games proceed and if there is common trend of when the goals are scored. The soccer game is 90 minutes long. There may be extra time if the winner of the game is undecided at the end of 90 minutes play. We will consider this extra time later.
Play with below interactive plot and explore the goal distribution for different time interval.
Tip: Start with time interval of 45 minutes.
ZoomIn
90th Minute of the Game
Below plot visualizes strongly emerging trend of 90th minute. From 1990 worldcup tournament 90th minute sees more and more goals.